Category Archives: Thinking

Cognition

Emotional Awareness Enables Focus, Risk-taking Even When “Stressed”

Jeremy Yip

Jeremy Yip

Greater emotional understanding enables people to quell the “incidental emotion” of anxiety while they focus on decisions, according to Wharton’s Jeremy Yip and Stéphane Côté of University of Toronto.

Stéphane Côté

Stéphane Côté

Incidental emotions that influence decision-making have been called “the affect heuristic” by University of Oregon’s Paul Slovic, Melissa Finucane of the East-West Center, Ohio State’s Ellen Peters, and Donald MacGregor, then of Decision Research.

Paul Slovic

Paul Slovic

People with greater emotional intelligence can separate unpleasant thoughts and feelings from decision making and are less likely to show the affect heuristic bias in risky decisions.

Sigmund Freud

Sigmund Freud

Sigmund Freud considered this ability to separate unpleasant thoughts and feelings as a defense mechanism deployed unconsciously to reduce anxiety and preserve self-esteem.
He called this experience “isolation,” contrasted with “compartmentalization,” which he defined as separating unpleasant emotions from each other.

Roy Baumeister

Roy Baumeister

Florida State’s Roy F. Baumeister, with Karen Dale then of Case Western, and Baruch College’s Kristin L. Sommer, documented recent studies that demonstrate “isolation” as a defense mechanism or coping strategy to contain negative feelings, “emotional contagion,” and “spillover.”

John Mayer

John Mayer

Yip and Côté demonstrated the relationship among emotional intelligence, evoked anxiety and propensity to make riskier choices in their lab studies of more than 100 volunteers, who completed the Mayer-Salovey-Caruso Emotional Intelligence Test developed by Yale’s Peter Salovey and David R. Caruso with John D. Mayer of University of New Hampshire.

David R Caruso

David R Caruso

One group received an anxiety-provoking assignment:  One minute to prepare a videotaped speech shown to peers studying “academic and social standing” at the university.
The other group was given a less stressful assignment:  Prepare a grocery list.

Volunteers in both groups could choose their compensation for participating in the study: Receive $1, or take a one in 10 chance to receive $10.

Melissa Finucane

Melissa Finucane

For those given the stressful speech-writing task, people who scored higher on emotional intelligence chose the riskier option to receive $10 three times as often as those who scored lower on emotional intelligence.

In contrast, volunteers who completed the low-stress task made similar choices for compensation no matter the level of emotional intelligence.

Ellen Peters

Ellen Peters

However, people can learn emotional awareness skills to enable mental focus and contain unrelated incidental emotions, according to related studies by Yip and Côté.

They demonstrated this ability to contain anxiety when some volunteers in the speech-writing task were told they “might feel worried” because making a speech is an anxiety-producing task.
Other speech-creators received no further instructions.

Kristin Sommer

Kristin Sommer

Yip and Côté “primed” no emotion among some grocery list-creators by saying that they “may feel no emotion” or no instructions.
Participants were then primed to separate their emotions from their decision-making by being told that their emotions were irrelevant to their decisions.

 Volunteers read information about the benefits of receiving flu injections and consequences of no inoculation during flu season.
Then participants were given the option to register for nearby flu injection clinic.

The reminder that emotions were irrelevant to decisions changed previous results, by increasing the frequency that participants with lower emotional awareness chose the riskier option of not attending the flu injection clinic.

 The findings suggest that adults can reduce emotional bias in decision-making by explicitly identifying emotions and separating them from critical thinking processes

Questions that enable people to separate emotions, thoughts, and decisions include:

  • How do I feel right now?
  • What is causing me to feel that way?
  • And are my feelings relevant to the decision I need to make?

-*How do you avoid the affect heuristic when making decisions?

RELATED POSTS:

©Kathryn Welds

Paradoxical Bias against Innovative Ideas in the Workplace

Jennifer Mueller
Jennifer Mueller

Managers’ implicit attitudes and cognitive “mindset” during proposal presentations can bias organizational decision-makers against innovative solutions without their awareness, according to University of San Diego’s Jennifer Mueller with Shimul Melwani of University of North Carolina and Cornell University’s Jack Goncalo.

Shimul Melwani
Shimul Melwani

Mueller and team pointed out a paradox:  Most managers say they want innovative solutions to workplace issues from team members, yet often reject these creative ideas to reduce risk and uncertainty.

The team asked volunteers to rate a running shoe equipped with nanotechnology that improved fit and reduced potential to develop blisters.

Jack Goncalo
Jack Goncalo

They “primed” some participants toward increased uncertainty in this task by telling them that there were many potential answers to a problem.
In contrast, they cued another group with reduced uncertainty by instructing them that a problem required a single solution.

When volunteers who said they favored creative ideas experienced uncertainty, they preferred concepts of practicality on an implicit word association test, and associated “creativity” with negative concepts including “vomit,” “poison” and “agony.”

Uncertain participants also rated the shoe as significantly less creative than those in the more structured condition, suggesting that were less able to recognize a creative idea and held an unconscious “negative bias against creativity.”

Cheryl Wakslak
Cheryl Wakslak

In more recent work, Mueller collaborated with University of Southern California’s Cheryl Wakslak and Viswanathan Krishnan with University of California, San Diego to expand the idea assessment scenario with two ideas that were independently rated as “creative,” and two ideas judged “not creative.”

Vish Krishnan
Vish Krishnan

Mueller, Wakslak and Krishnan cued some participants to consider “why” in evaluating creative ideas, to evoke broad, abstract thinking, and “high-level construal.
They instructed other volunteers to think about “how” creative idea works, to stimulate narrow focus on practical details and logistics, and “low-level construal.”

Although participants in both groups rated two non-creative ideas similarly, those who adopted a “high-level construal” or a “why” mindset recognized creative ideas more often than those using the “how” mindset.

As an idea’s degree of creativity increases, uncertainty also increases about its feasibility, acceptability, and practicality.
This increased risk may reduce evaluators’ willingness to accept and advocate for an innovative idea, even when objective evidence is presented to validate a creative idea.

To mitigate the paradoxical rejection of creative ideas, organizational leaders can ask team members to consider “why” when creative evaluating proposals to enable “big picture” thinking and a broader construal level.

-*How do you encourage innovative solutions to work challenges?

Follow-share-like http://www.kathrynwelds.com and @kathrynwelds

RELATED POSTS:

©Kathryn Welds

Music Preferences Indicate Personality Traits

Besides individual aesthetic preferences, people may prefer musical genres to “regulate” mood or express self-image.

-*Does personality style shape musical preferences?
-*Does preferred music affect personality?

Peter Jason Rentfrow

Peter Jason Rentfrow

University of Cambridge’s Peter Jason Rentfrow and Samuel Gosling uncovered four music-preference dimensions when they analyzed music preferences of more than 3,500 individuals in six studies:

  • Reflective and Complex
  • Intense and Rebellious
  • Upbeat and Conventional
  • Energetic and Rhythmic

These music-preference categories were related to cognitive abilities like verbal IQ and attitudes like political orientation in addition to Big Five personality dimensions.

In other studies, Rentfrow and Gosling found that musical preference accurately predicted Big Five personality traits including “Openness to Experience”, Extraversion, and Emotional Stability among strangers when they asked same-sex and opposite-sex volunteers with an average age of 18  to “get to know each other” over 6 weeks.

Rentfrow and Gosling found significant correlations between musical genre preferences and Big Five personality characteristics:

  • Blues: High self-esteem, creative, outgoing, gentle, at ease
  • Jazz: High self-esteem, creative, outgoing, at ease, intellectual
  • Classical: High self-esteem, creative, introvert, at ease
  • Rap: High self-esteem, outgoing
  • Opera: High, gentle self-esteem, creative
  • Country and Western: Hardworking, outgoing, emotionally stable
  • Reggae: High self-esteem, creative, not hardworking, outgoing, gentle, at ease
  • Dance: Creative, outgoing, not gentle
  • Indie: Low self-esteem, creative, not hard working, not gentle
  • Bollywood: Creative, outgoing
  • Rock/heavy metal: Low self-esteem, creative, not hard-working, gentle, at ease, not outgoing,
  • Chart Pop: High self-esteem, hardworking, outgoing, gentle, not creative, not at ease
  • Soul: High self-esteem, creative, outgoing, gentle, at ease
  • Vocals: Extraverted

Marvin Zuckerman

Marvin Zuckerman

Additional support for the relationship between music preference and personality characteristics came from University of Melbourne’s David Rawlings and Vera Ciancarelli in their study correlating responses on University of Delaware’s Patrick Little and Marvin Zuckerman‘s Music Preference Scale and the NEO Personality Inventory (Revised).

Individuals who scored high on extraversion and women tended to prefer
“Popular Music
” and those who scored high on “Openness to Experience” showed strong “Breadth of Musical Preference.”

This study related “sensation seeking” to musical preferences and confirmed speculation that people who seek greater levels of environmental stimulation through auditory, visual, gustatory, and other experiences tend to like complex, intense music.

High scorers on Sensation Seeking Scale form V preferred Rock music and but not Soundtrack music and those who scored high on Thrill and Adventure Seeking subscale and Experience Seeking subscale liked Folk and Classical music in addition to Rock music.
As might be expected, participants who scored high on the Disinhibition subscale liked Rock but not Religious or Soundtrack music.

Hans Eysenck

Hans Eysenck

“Extraversion” has been related to “sensation seeking” in Hans Eysenck’s seminal research.
Southern Illinois University’s Stephen J. Dollinger demonstrated that people who report behaviors and traits associated with extraversion tend to prefer Jazz, which has “high arousal properties” and those who endorse “excitement seeking” behaviors said they prefer Hard Rock music.

Stephen Dollinger

Stephen Dollinger

These generalizations may change as people age, so Nazarene University College’s Kelley Schwartz and Gregory Fouts of University of Calgary examined 164 adolescents’ music preferences in relation to personality dimensions and developmental issues.

Gregory Fouts

Gregory Fouts

Those who preferred music with “heavy” or “light” qualities reported personality and developmental difficulties, but those who preferred “eclectic” music reported no personality or developmental concerns.

Schwartz and Fouts concluded that adolescents prefer music that reflects personality characteristics and developmental challenges, supporting Renfrow and Gosling’s caveat that results for adult musical preferences may not reflect the same personality characteristics among people in other age groups.

Taken together, these findings on personality trends related to musical preferences among adolescents and adults suggest that when people master specific developmental issues, music relevant to those challenges may no longer be appealing, and preferences may change.

-*To what extent do you prefer music that “regulates” your mood and productivity?

-*How accurately can you infer people’s personality traits from their musical preferences?

Please follow-share-like www.kathrynwelds.com and @kathrynwelds

RELATED POSTS:

Twitter  @kathrynwelds
Blog – Kathryn Welds | Curated Research and Commentary  
Google+
LinkedIn Open Group Psychology in Human Resources (Organisational Psychology)
Facebook Notes

©Kathryn Welds

Emotional Music Can Lead to Biased Judgments

Joydeep Bhattacharya

Joydeep Bhattacharya

Emotions elicited by music influence can influence and even bias visual judgments, according to University of London’s Nidhya Logeswaran and Joydeep Bhattacharya.

They presented volunteers with short excerpts of “happy” music or “sad” music, then showed neutral, “happy,” and “sad” faces.
When people listened to a “happy” music, they were more likely to perceive faces as “happy” even when the face was neutral.
Similarly, the “priming” with “sad” music was associated with more ratings of faces as “sad,” even if they were neutral.

The team also observed the effects of musical “priming” in electrophysiological measures of brain potential components within 100 milliseconds after the faces were presented, suggesting rapid neuronal information processing.

Even if listeners’ perceptions and judgments can be biased by emotional music, listeners do not experience the precise emotions they hear in music.

Kiyoshi Furukawa

Kiyoshi Furukawa

Listeners can identify strong emotions conveyed by music, but do not experience the same degree or type of emotion, according to Tokyo University of the Arts’s Ai Kawakami and Kiyoshi Furukawa, who collaborated with University of Tokyo’s Kentaro Katahira and Kazuo Okanoya.

Kazuo Okanoya

Kazuo Okanoya

Kawakami and team distinguished “perceived emotion” from “felt emotion” in response to music, and presented two pieces of “sad” music (Mikhail Glinka’s “La Séparation” in F minor) and one piece of “happy” music to 44 volunteers, both musicians and non-musicians.

Mikhail Glinka

Mikhail Glinka

Participants rated their perceived emotions and felt emotions in response to each musical selection using 62 descriptions on a scale from 0 (not at all) to 4 (very much).
Although participants recognized the “sad” music’s negative emotions, most reported feeling “romantic,” and “blithe,” rather than negative or unpleasant.

Muzak

Muzak

“Muzak” (now Mood Media) audio in workplaces can evoke emotional responses that may lead to biased business decisions.

As long ago as the 1950s, concerned American citizens claimed that Muzak practiced “brainwashing” with its planned musical sequences in quarter-hour segments.

Muzak Stimulus ProgressionMuzak’s playlist is synchronized to time of day to “increase energy” at predicted low-energy times based on its patented “Stimulus Progression.
These 15-minute sequences feature about six songs with varying “stimuli values,” based on tempo, rhythm, instrumentation and orchestra size.
The next 15-minute period features silence.
Mood Media
Over a 24-hour period, tunes with higher “stimulus value” are played when people are typically “lethargic” – 11 a.m. and 3 p.m., and slower songs are played “after lunch” and at the end of the work day.
Muzak claimed that this programming “increases morale and productivity at workplaces, increase sales at supermarkets, and even dissuade potential shoplifting at department stores.”

The emotional tone of music may bias other cross-sensory judgments.
Adrian C. North, working at University of Leicester and Herriott Watt University, tested the effect of music in a supermarket on wine selections and olfactory/gustatory judgments wine’s properties.

North ensured that French accordian music or German Bierkeller brass band music were played on alternating days for two weeks at the supermarket.
French wines and German wines had similar prices and their order on the shelf was changed each day.

After 82 shoppers selected wines, an interviewer asked customers to complete a questionnaire about the purchase, including:

  • Preference for French or German wines
  • Extent to which the music brought to mind France or Germany
  • Degree to which the music influenced specific wine selection.

The results from 44 shoppers suggest that music influenced shoppers’ wine selections:  More French wine was sold when French music played (40 bottles of French wine vs 8 bottles of German wine), and more German wine was sold when German music played (22 bottles of German wine vs 12 bottles of French wine).

North concluded that barely audible music can implicitly, unconsciously affect thoughts, perceptions, decisions, and even buying action.

Charles Areni

Charles Areni

Music can trigger thoughts similar to the music’s mood, context, or speed, according to the Preference-for-prototypes model proposed by Macquarie University’s Charles Areni and David Kim of Texas Tech.

-*When have your judgments and performance been altered by ambient music?

Follow-share-like http://www.kathrynwelds.com and @kathrynwelds

RELATED POSTS:

©Kathryn Welds

Women’s Multitasking Skill Linked to Neural Network Patterns

Diane Halpern

Diane Halpern

Differences between men’s and women’s performance on cognitive tasks, particularly mathematics and science have been observed for decades, with men generally excelling at motor and spatial tasks and women excelling in memory and social cognition tasks.

Camilla Benbow

Camilla Benbow

Claremont McKenna College’s Diane F. Halpern led an extensive review of these performance differences with Camilla P. Benbow of Vanderbilt University, University of Missouri‘s David C. Geary, Ruben C. Gur of University of Pennsylvania, Janet Shibley Hyde and Morton Ann Gernsbacher of University of Wisconsin. 

David Geary

David Geary

Their evidence “provided no single or simple answer” to contrasting skills by gender but a comprehensive brain imaging study of more than 400 males and more than 500 females between ages 8 and 22 years, provides evidence for popular observations.

Madhura Ingalhalika

Madhura Ingalhalika

Using diffusion tensor imaging, University of Pennsylvania’s Madhura Ingalhalikar, Alex Smith, Drew Parker, Theodore D. Satterthwaite, Mark A. Elliott, Kosha Ruparel, Raquel E. Gur, Ruben C. Gur and Ragini Verma with Hakon Hakonarson of Children’s Hospital of Philadelphia, demonstrated that male and female brains differ in the network of neural connections.
Known as the “structural connectome,” these connections between neural structures were described by Indiana University’s Olaf Sporns, who reviewed imaging techniques to visualize their activity.

Ted Satterthwaite

Ted Satterthwaite

These gender-linked structural differences result in differing competencies.
Ingalhalikar’s team observed that male brains structures show more connections within the front and back of the brain hemisphere in the supratentorial region.

Olaf Sporns

Olaf Sporns

This area connects perception and coordinated action and enables males’ skill in quickly perceiving and applying information to a single complex task, spatial reasoning, and learning motor skills.

Ingalhalikar connectomeIn contrast, female brains contain more neural connections between hemispheres in supratentorial regions. 
This connection pattern enables females to recall faces and execute multiple complex tasks simultaneously more easily than males due the increased neural connections between analytical and intuitive processing modes.

Dardo Tomasi

Dardo Tomasi

Building on earlier work on these differences by Brookhaven National Lab’s Dardo Tomasi and Nora D. Volkow of National Institute on Drug Abuse, Ingalhalikar’s team found these differences were reversed in the cerebellar connections, where male brains showed greater intrahemispheric connectivity and female brains demonstrated more interhemispheric connections.

Nora Volkow

Nora Volkow

These structural differences lead to different development for girls and boys from an early age, and result in significant, less modifiable differences by adolescence and adulthood. 

Frequently-observed differences in male and female performance are rooted in different neural connection patterns by gender.

 -*What exceptions have you seen to findings of women’s skill in multitasking and social insight, and men’s competence in spatial reasoning and motor skill acquisition?

RELATED POSTS:

Follow-share-like http://www.kathrynwelds.com and @kathrynwelds

Twitter  @kathrynwelds
Blog – Kathryn Welds | Curated Research and Commentary  
Google+
LinkedIn Open Group Psychology in Human Resources (Organisational Psychology)
Facebook Notes

©Kathryn Welds

Detecting Trustworthiness, Opening Your Mind?

Yaacov Schul

Yaacov Schul

-*Does mistrust increases willingness to consider new information, or “open-mindedness”?

When people mistrust information, they are more likely to consider alternative information and interpretations,  according to Hebrew University’s Yaacov Schul and Ruth Mayo, with Eugene Burnstein of University of Michigan.

Ruth Mayo

Ruth Mayo

Likewise, Ann-Christin Posten and Thomas Mussweiler of Universität zu Köln noted that “distrust frees your mind” by leading people to use non-routine cognitive strategies.”

Eugene Burnstein

Eugene Burnstein

Posten and Mussweiler reported that when volunteers participated in an “untrustworthy” interaction, they later provided less stereotypic evaluations of others in an unrelated task.

Ann-Christin Posten

Ann-Christin Posten

The research team replicated this effect when they influence volunteers’ expectations of others by “priming” participants with preliminary information that elicited stereotypes.

When people distrust information and interactions, they focus on dissimilarities and discrepancies,  which enables people to more carefully attend to individual differences that disprove stereotypes, according to Posten and Mussweiler.

Thomas Mussweiler

Thomas Mussweiler

Although trust may feel better, distrust can lead to more mindful observation, and reduced stereotyping.

-*How do people determine trustworthiness?

Princeton’s Alexander Todorov and Sean G. Baron with Nikolaas Oosterhof of Dartmouth presented volunteers computer model-generated faces  representing a range of trustworthiness while participants’ brains were scanned with fMRI.

Alexander Todorov

Alexander Todorov

Specific brain areas, the right amygdala and left and right putamen, became more active when participants’ viewed less trustworthy faces.

Sean Baron

Sean Baron

Faces judged most trustworthy and most untrustworthy faces were associated with greater brain activity in the left amygdala.
In contrast, moderately trustworthy faces evoked strongest responses in the medial prefrontal cortex and precuneus areas.

Nikolaas Oosterhof

Nikolaas Oosterhof

These findings pinpoint brain areas that lead to inferences of trust and distrust, and lead to relaxed or vigilant information processing strategies.

-*How do you determine trustworthiness for information and for people?
-*What helps you minimized stereotyped judgments?

 Follow-share-like http://www.kathrynwelds.com and @kathrynwelds

RELATED POSTS:

Twitter  @kathrynwelds
Blog – Kathryn Welds | Curated Research and Commentary  
Google+
LinkedIn Open Group Psychology in Human Resources (Organisational Psychology)
Facebook Notes:

©Kathryn Welds

An End to “Death by PowerPoint”: Neuroimaging Studies Improve Visual Display Design

Stephen Kosslyn

Stephen Kosslyn

Harvard’s Stephen Kosslyn‘s fMRI studies of perceptual processes and mental imagery point to  best practices in improving visual display design, such as PowerPoint presentations, so they can be rapidly comprehended.

Alexandra Russell

Alexandra Russell

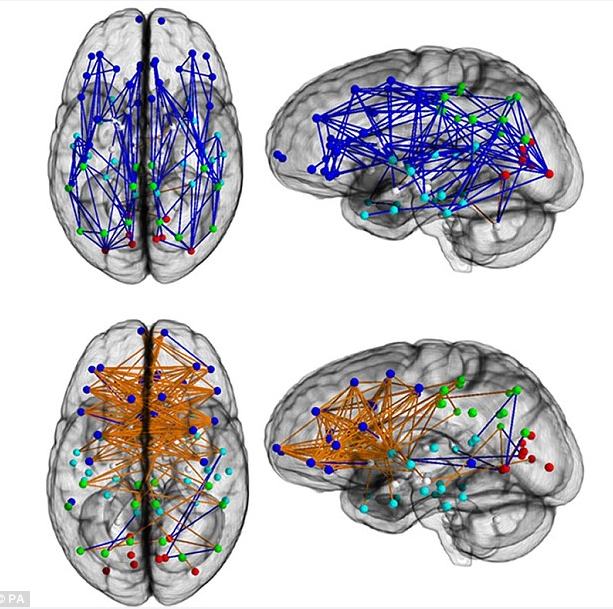
His imaging studies determined that the left half of the brain excels at encoding categories and generating mental images based on categories.
In contrast he reported that the right half of the brain skillfully encodes specific examples and generating associated images.

While at Stanford, he identified eight psychological principles often violated in PowerPoint® slideshows, in collaboration with Alexandra G. Russell, Harvard colleague Jennifer M. Shephard and Rogier A. Kievit of University of Amsterdam.

Once the viewer has seen a PowerPoint slide, the information must be converted into a storable and retrievable construct for later use.

Rogier Kievit

Rogier Kievit

They noted that perception and comprehension of visual displays require:

  • Encoding based on Discriminability, Perceptual Organization, Salience
  • Working Memory, influenced by Limited Capacity and Informative Changes
  • Accessing Long-Term Memory, enhanced by Appropriate Knowledge, Compatibility, Relevance

 Encodable content must be distinguishable from the background and context.
This requires a “Just Noticeable Difference” (JND) between size, shape, color and other attributes to enable discrimination.

Russell De Valois

Russell De Valois

PowerPoint elements achieve Discriminability with:

  • Sufficiently large typeface with differentiated text (mix of upper case, lower case, bold, italics)
  • Text and graphic color contrast with background color
  • Spatial frequency channel” ratio variance, such as points that are twice as thick as the lines that connect them

    Karen De Valois

    Karen De Valois

    Texture patterns elements, like stripes, should vary by at ratio of least 2:1 to avoid “visual beats,” according to University of California’s Russell DeValois and Karen De Valois

  • Varied line orientation (by at least 30°), to enable processing by different “orientation channels
  • Text or other fine lines in colors other than deep blues, and boundaries in colors other than red.

After encoding, figure/ground segregation processes perceptually organize adjacent (“Law of Proximity”) and similar (“Law of Similarity”) elements into groups of objects, words, and graphics.
Grouping also can be imposed by lines, such as in complex data tables, and this grouping typically increases readability and comprehension.

Additional practices to enhance visual “consumability” by Perceptual Organization include:

  • Applying labels to refer to the nearest graphic element
  • Using a common color to organize parts of a display into a group, even separated
  • Adopting consistent ordering conventions across different parts of displays, such as bar chart legends and pie chart legends
  • Explicitly grouping separated-but-related elements, such as by using inner grid lines to group the tops of bars in a bar graph with locations along the Y axis at the left of the graph
  • Eliminating inadvertently-formed groupings, such as when a banner at the top of a slide groups with nearby, similar but unrelated objects

 Attention is drawn to large perceptible differences, and these elements are processed in detail.  The brain’s superior colliculus draws visual attention to large differences among stimuli.
Salience can be enhanced with:

  • Animation because movement captures and directs attention
  • Text with a distinct format, such as color, size, or typeface
  • Visual incongruities, such as a wedge “exploding” from a pie chart
  • Summary elements like title, keywords, topic sentence, infographic
  • Warm” colors (with longer wavelengths, such as red) for emphasis or in the foreground in contrast to “cool” colors (with short wavelengths, like blue), which recede.
    Avoid using warmer colors for lines that pass beneath other lines to avoid the illusion of background oscillation

After visual patterns are encoded, they must be integrated in Working Memory for later retrieval and application, and are influenced by Limited Capacity and Informative Changes.
People have limited capacity to process and retain information, and presentations can mitigate these constraints by:

  • Limiting perceptual groups to about four units with up to four sub-units for easier processing and retrieval
  • Labeling items in a display rather than using a key or legend to reduce processing load
  • Allowing the audience time to process and assimilate information during a slide presentation
  • Avoiding slow fade-in or fade-out slides, which may lead to incorrect information processing and losing track of the organizational hierarchy.Audience members expect Informative Changes in words and graphics to convey information.
    Similarly, they also expect that each expect unit of information is associated with a perceptible change.
    Capitalize on these expectations by:
  • Avoiding random or arbitrary changes in appearance, transitions, or terminology
  • Clearly indicating section beginnings and ends to enable audience to track progress through the presentation

Retrieving information from Long-Term Memory enables viewers to compare with previously stored information to determine the new information’s relevance and applicability.

Effective presenters ensure that viewers have a common knowledge base of novel concepts, jargon, conventions, formats, terminology or symbols so they understand the presentation’s context.
Presenters ensure Appropriate Knowledge by including an explicit introduction, and explanation and review of these terms and ideas before building reasoning and conclusions.

Kosslyn-Stroop EffectA message is most intelligible and memorable when its form is Compatible with its meaning.
The Stroop effect demonstrates the difficulty people have in processing information when asked to name the color of the ink used to a color name (“red”) a different color from the ink (blue).

Similarly, people are better able to comprehend when audio and visual contents coordinate with text and the overall message.

  • Indicate quantitative difference by color saturation and intensity (or brightness)
    These “prothetic” variables are arranged quantitatively.
    In contrast, hue is ineffective as a measure of quantitative differences because it is a “metathetic” variable that is arranged qualitatively
  • Ensure that animation movements align with the object’s natural movement patterns, such as an automobile entering from the side of the slide rather than the top
  • Select sounds, typefaces, and backgrounds consistent and compatible with the content. such as sans serif typeface for high tech products
  • Use icons that depict the typical examples of represented items, such as a duck to represent “fowl” or “wild bird” but not “pet bird”
  • Include line graphs (rather than bar or mixed graphs) to illustrate trends and interactions:  The continuous variation in the height of a line in a graph directly indicates the continuous variations of a measurement
  • Apply bar graphs to illustrate specific values instead of trends because the discrete heights of the bars directly indicate specific measurements
  • Add maps to illustrate complex information about geographic territories or show alternate routes to a destination
  • Consider charts to portray organizational structure, sequential steps, or processes as in “flow charts.”

Presentations must offer most applicable, meaningful content for the topic in sufficient but not excessive detail.
Enhance Relevance by:

  • Curating content
  • Enabling viewers to organize the information into a narrative by presenting a roadmap of the topic in an outline or overview
  • Providing graphic elements including photos, drawings, graphs, diagrams, and video as well as audio to illustrate concepts clearly and label ambiguous imagery.

Don McMillan

Don McMillan

If presenters adopt Kosslyn’s recommendations, to enhance Discriminability, Perceptual Organization, Salience, Limited Capacity, Informative Changes, Appropriate Knowledge, Compatibility, and Relevance, PowerPoint comedians Don MacMillan and biologist Tim Lee may need to revert to their previous occupations. 

Tim Lee

Tim Lee

-*How do you ensure that your Business Storytelling with PowerPoint keeps your audience engaged?

Follow-share-like http://www.kathrynwelds.com and @kathrynwelds

RELATED POSTS:

Twitter  @kathrynwelds
Blog – Kathryn Welds | Curated Research and Commentary  
Google+
LinkedIn Open Group Psychology in Human Resources (Organisational Psychology)
Facebook Notes:

©Kathryn Welds

Mindfulness Impedes Implicit Learning, but May Enhance Explicit Learning

Chelsea Stillman

Chelsea Stillman

People typically develop habits without consciously and “mindfully” thinking about them, and habits often develop through “implicit” or unconscious learning.
Moreover, the trait of mindfulness can interfere with habit formation and pattern recognition, according to Georgetown’s Chelsea Stillman, Alyssa M. Coffin, James H. Howard and Darlene Howard.

Chelsea Stillman-Triplet Learning TaskMany recent studies linking positive outcomes to increased mindfulness, so this caveat may be surprising.

James Howard

James Howard

Adult volunteers completed an inventory that assessed their degree of mindfulness as a character trait rather than as a transient state.
They also completed either an alternating serial reaction time task or a triplet-learning task using colored circles to assess their ability to learn complex, probabilistic patterns.

Darlene Howard

Darlene Howard

Those who scored high on trait mindfulness were less effective in detecting and learning the patterns than those with lower mindfulness scores.

Stillman concluded that high attention and awareness of stimuli may inhibit implicit learning, suggesting many questions about situations in which mindfulness is most effective.

Previous blog posts noted that mind wandering may have other virtues, like enabling innovative problems solving.

Travis Proulx

Travis Proulx

Implicit learning, such as required to develop habits, is helped by “unrelated meaning threats” in addition to mindlessness, according to Tilburg University’s Travis Proulx and Steven J. Heine of University of British Columbia.

They provided volunteers with an “unrelated meaning threat” in a short story by Franz Kafka or in a task requiring participants to “argue against one’s own self-unity.” Other participants received no “unrelated meaning threat” to serve as a comparison group.

Steven Heine

Steven Heine

Those who received the threat showed increased detection of patterns within letter strings and better performance on a artificial-grammar learning task, in which they detected a novel pattern embedded in the letter strings.

Proulx and Heine concluded that people may use association patterns unrelated to the original meaning threat when trying to maintain meaning, which they called the “meaning-maintenance model.

Gavriel Solomon

Gavriel Solomon

Differing findings were reported by University of Haifa’s Gavriel Solomon and Tamar Globerson of Tel Aviv University, who found that mindfulness may augment explicit rather than implicit learning.
They argued that
effortful, volitional mindful attention is a key contributor to learning and bridging “the know-doing gap,” described by Stanford’s Jeffrey Pfeffer, supporting recent “pro-mindfulness” findings.

Jeffrey Pfeffer

Jeffrey Pfeffer

-*How do you use mindfulness and mindlessness to enhance learning and creative problem solving?

Follow-share-like http://www.kathrynwelds.com and @kathrynwelds

RELATED POSTS:

Twitter  @kathrynwelds
Blog – Kathryn Welds | Curated Research and Commentary  
Google+
LinkedIn Open Group Psychology in Human Resources (Organisational Psychology)
Facebook Notes:

©Kathryn Welds

Reading Literary Fiction Increases “Theory of Mind” Empathic Insight

Franz Kafka

Franz Kafka

Franz Kafka opined that people should read literature as “an axe to break the frozen sea inside us.”

David Comer Kidd-Emanuele Castano

David Comer Kidd-Emanuele Castano

New School for Social Research’s Emanuele Castano and David Comer Kidd showed the effectiveness of Kafka’s recommendation:  Reading award-winning literary fiction increased emotional intelligence, social perception, and empathy, known as Theory of Mind (ToM) abilities.

Theory of Mind (ToM) skills enable people to recognize and infer mental states like emotions, attitudes, concerns, and beliefs, and to understand that other people may have different beliefs, wishes, and goals.

In contrast, people with autism spectrum disorders, schizophrenia, attention deficit hyperactivity disorder, neurotoxicity due to alcohol abuse, can experience ToM deficits.

Castano and Kidd asked volunteers ages 18 to 75 to read:

  • Commercial fiction or
  • Literary non-fiction or
  • Factual non-fiction or
  • Nothing

Next, they asked participants to describe their own emotional states, or people’s emotions from photographs of their eyes.

Those who read literary fiction more accurately judge others’ emotions, a measure of emotional intelligence, social perception, and empathy.
Results demonstrated that literary fiction, which requires making inferences about characters, their emotions, relationships, and motivations, triggered this increased social insight.

Simon Baron-Cohen

Simon Baron-Cohen

Examples of tests to assess these skills are summarized by Simon Baron-Cohen, an expert on autism, and cousin of comedian Sacha Baron Cohen, along with the New School Researchers.

P. Matthijs Bal

P. Matthijs Bal

Vrije Universiteit‘s P. Matthijs Bal and Martijn Veltkamp of FrieslandCampina differentiated “transporting” fiction that “emotionally transported the reader into the story” with fiction that did not.

Martijn Veltkamp

Martijn Veltkamp

Bal and Veltkamp found that reading “transporting” fiction increases the reader’s empathic capabilities, but not fiction that lacks “transporting” qualities.

-*Which works of literary fiction have influenced your attitudes and empathic attunement with others?

Follow-share-like http://www.kathrynwelds.com and @kathrynwelds

RELATED POSTS:

©Kathryn Welds

Explicit Gratitude Increases Well-Being, Reduces Materialism

Robert Emmons

Robert Emmons

Gratitude, or appreciating a beneficial outcome, has significant benefits to physical and emotional health, according to Robert Emmons at the University of California.

He found that volunteers who kept a gratitude journal exercised more frequently, reported fewer physical symptoms of pain, were more optimistic about the upcoming week, and showed greater progress towards personal goals over a two-month period than people who kept journals that reported events factually or allowed them to complain.

Jeffrey Froh

Jeffrey Froh

Emmons worked with Hofstra’s Jeffrey J. Froh and Giacomo Bono of California State University, Dominguez Hills to consider gratitude in contrast to happiness among 700 middle school students, who completed measures of gratitude, prosocial behavior, life satisfaction, and social integration, with re-measures after 3 months and 6 months.

Giacomo Bono

Giacomo Bono

Emmons and team found that students who expressed gratitude initially showed greater social integration after 6 months, and these dimensions enhanced each other.
Theyposit that gratitude may help young people develop greater emotional and social well-being, and prosocial contribution to their communities.

Jennifer Wilson

Jennifer Wilson

This team was joined by Hofstra’s Jennifer Wilson and Noel Card of University of Arizona in another study of young adults who practicing daily gratitude exercises.

These volunteers reported higher levels of alertness, enthusiasm, determination, attentiveness and energy compared to people who focused on social comparisons with people in better or worse life situations than they.

Noel Card

Noel Card

The year-end holiday season often provokes reflections on materialism and gratitude.

Emily Polak

Emily Polak

Materialistic strivings have been implicated as a cause of unhappiness, whereas gratitude as a trait and as a temporary state can be related to happiness, according to Albert Einstein College of Medicine’s Emily L. Polak and Michael E. McCullough of University of Miami’s.

Michael McCullough

Michael McCullough

They note that gratitude may reduce materialistic strivings and reduce associated unhappiness to increase well-being.

-*How effective is conscious gratitude on increasing happiness, well-being, and social integration?

 Follow-share-like http://www.kathrynwelds.com and @kathrynwelds
RELATED POSTS:

Twitter  @kathrynwelds
Blog – Kathryn Welds | Curated Research and Commentary  
Google+
LinkedIn Open Group Psychology in Human Resources (Organisational Psychology)
Facebook Notes:

©Kathryn Welds